AWS Status Monitoring How to Proactively Avoid Costly Downtime
· 19 min read

You’re in the middle of a big deployment. You push code, tests pass, and then everything goes dark.

Your API calls time out. Your users see errors. You start debugging your code, but it’s not your fault. AWS is having an outage.
Cloud incidents like this are not rare. They happen to every team, no matter how well you plan. When core services like AWS Lambda go down, your productivity stops cold. That’s why keeping an eye on AWS status is not just nice to have. It’s essential.
Understanding AWS status helps you know what’s really happening. The official AWS Health Dashboard shows you if a service is healthy or having issues. As Atlassian explains in their complete guide, the status page splits into current status and history. But just visiting the page when something breaks is too late. You need to stay ahead.
In this guide, we will cover everything you need to know about monitoring AWS status. You’ll learn how to use the dashboard, set up alerts, and build apps that survive outages. These tips work whether you run a single serverless function or a full environment with a Google Cloud project on the side.
Being proactive saves hours of stress. And staying informed about the broader tech world helps too. For daily insights that keep you sharp, check out the The Deep View Newsletter. It delivers clear AI and tech updates straight to your inbox.
Ready to get a grip on AWS status? Let’s start with the official dashboard.
Understanding AWS Status: Official Channels and Incident Communication
When something breaks, your first stop should be the AWS Health Dashboard. This is the single official place where Amazon posts real time service health for every region and service. Think of it as the central command center for aws status. The page splits into two main areas: Current Status and Status History. As the Atlassian guide explains, Current Status shows green, yellow, or red icons for each service. You can quickly see if AWS Lambda is having issues in your region before you waste time debugging your own code.
But what happens after the status page turns red? That is where incident communication comes in. AWS posts detailed updates as an outage unfolds. You will see timestamps, affected services, severity levels, and what AWS is doing to fix the problem. The AWS Health Dashboard documentation shows that you can also view a log of interruptions from the past 12 months. After an incident resolves, AWS often publishes a post mortem with root cause analysis. Understanding severity levels (like "operational issue" versus "service disruption") helps you decide how fast to react.
You do not have to rely only on the dashboard. Third party tools like StatusGator can send alerts when aws status changes. There is also an open source tool on GitHub that checks the official page programmatically. This kind of automation is useful when you run multiple environments, including a google cloud project, and need a single view of health.
Knowing how to read the official channels saves you time and reduces panic. For more tips on building reliable systems, check out our guide on how to evaluate quantum computing companies for your software stack. And to stay ahead of the latest tech news and outage reports, the The Deep View Newsletter delivers clear daily updates straight to your inbox.
The Real Cost of AWS Outages to Development Teams
You are in the middle of a deploy. Your team is pushing a critical update. Then AWS Lambda calls start failing. Your app goes dark. Within minutes, your phone is buzzing from angry product managers.

That sinking feeling is not just stress. It is real money.
In 2026, the numbers are scary. According to ITIC’s research, a single hour of IT downtime costs the average mid-size or large enterprise over $300,000. For Fortune 1000 companies, that number can exceed $1 million per hour. Even small businesses feel it, losing up to $427 per minute when systems go dark, as HD Tech reports.
But the dollar signs tell only part of the story.
The real pain for development teams comes in lost developer hours. When aws status shows red, your engineers stop building and start firefighting. Context switching is brutal. A developer who was deep in code gets pulled into an incident call. After the outage ends, it takes 15 to 30 minutes to get back into the flow. Multiply that by a team of ten across a two hour outage, and you have lost a full day of productive work.
Rework is another hidden cost. If your team was deploying when the outage hit, that deploy may be in a broken state. You might need to roll back, fix dependencies, or debug issues that only show up when services come back. The Splunk report notes that companies lose an average of $300 million a year to unplanned outages overall, and a single incident can drop stock prices by 3.4%.
And here is the thing: this does not just affect teams using AWS. If you run a google cloud project alongside AWS, an AWS outage can still break your multi-cloud setup when services are tightly coupled. The outage cascades.
The good news is that these costs are not inevitable. With proper monitoring and incident response, you can cut recovery time by minutes. That is why more teams are investing in automated tools to detect aws status changes instantly. For practical ways to reduce downtime through smarter coding workflows, check out our guide on AI coding assistants in 2026.
When you put hard numbers next to your next outage, the case for better monitoring becomes impossible to ignore.
Top Third-Party Tools for Monitoring AWS Status in 2026
Waiting for the official AWS status page to update can cost you thousands. By the time that dashboard turns red, your users have already seen errors. Third-party monitoring tools catch problems faster, often minutes before Amazon says anything. That head start is your chance to reroute traffic, scale up backups, or warn your team before the fire spreads.
So which tools deserve a spot in your stack? The best choice depends on what you need, but several platforms consistently rise to the top in 2026.
The Heavy Hitters
Datadog remains a favorite for teams running complex cloud setups.
It integrates with multiple providers, so if you also run a google cloud project alongside AWS, you can see everything in one dashboard. Datadog’s real time alerts for services like AWS Lambda are especially useful. When Lambda invocation errors spike, you know before your customers do. The DeepCost blog includes Datadog in its top five AWS monitoring tools for its AI-driven anomaly detection.
New Relic offers deep observability for full stack applications. It tracks performance from your frontend down to your database. The New Relic blog highlights how its cloud monitoring tools give you a single pane of glass for AWS, Google Cloud, and others. For developers who hate context switching, that matters.
Dynatrace uses AI to automatically detect root causes during an outage. It maps dependencies between services, so when aws status shows green for something else, Dynatrace might flag a hidden bottleneck. The Simply Secure Group list names Dynatrace as a top choice for enterprise teams.
Free and Open Source Options
You do not need a big budget to get great coverage. SigNoz is an open source alternative that provides distributed tracing and metrics without vendor lock in. The SigNoz comparison covers how it stacks up against paid tools like Datadog. nOps also offers a free tier focused on AWS cost and health monitoring. Their overview explains how it helps SMBs avoid surprise bills and downtime.
Which Tool Should You Pick?
Start with your biggest pain point. If you need quick alerts across multiple cloud providers, Datadog or New Relic work well. If cost is a concern, try SigNoz or nOps first. No matter which tool you choose, the key is setting up alerts that match your team’s workflow. If you are building a startup and want to learn how other founders structure their monitoring stack, check out our guide on startup app development trends in 2026.
Third-party tools turn aws status from a reactive panic into a proactive signal. That small investment pays for itself the first time you catch an outage early and keep your app running.
Integrating AWS Status Monitoring into Your CI/CD Pipeline
You have your monitoring tool picked out. Now comes the real payoff: wiring that tool into your CI/CD pipeline so bad deployments never make it to production. When your pipeline automatically checks the current aws status before each release, you stop shipping code that depends on broken services.
Here is how to set that up in 2026.
Automated Checks Prevent Disaster
Most CI/CD platforms like GitHub Actions, GitLab CI, or Jenkins let you run custom scripts at any stage. Add a step that queries the AWS Health API or your monitoring tool’s API before you deploy. If the response shows an active incident affecting services like AWS Lambda or EC2, the pipeline fails instantly. No human has to watch a dashboard. Your team gets a clean block that saves everyone from a bad roll.
Many monitoring tools expose webhooks that push status changes directly to your pipeline. For example, you can configure Datadog or New Relic to send a webhook when a critical incident starts. Your pipeline listens for that signal and pauses all deploys until the aws status clears. The DeepCost blog lists Datadog as a top tool for real time alerts, and those alerts are exactly what you need for pipeline hooks.
Best Practices for Pipeline Gates
Setting a gate is simple in theory but tricky in practice. Follow these rules:
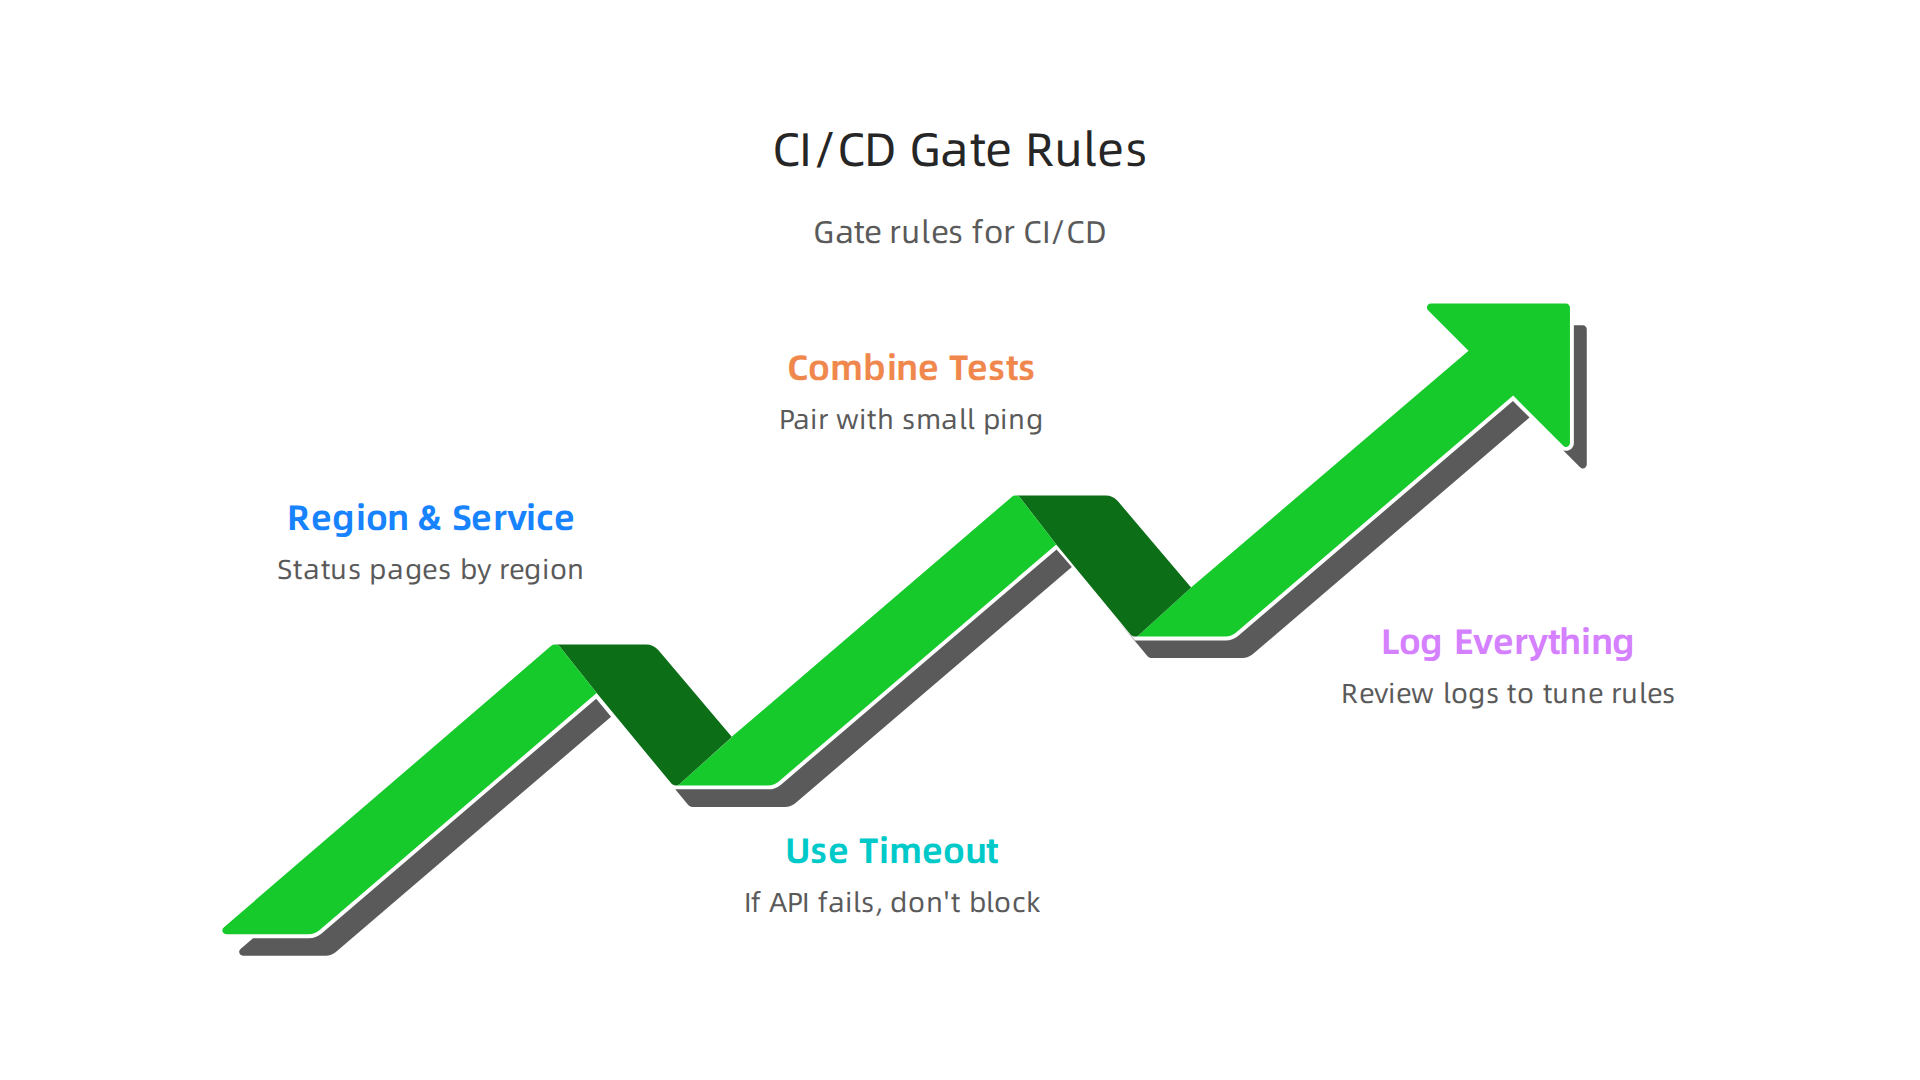
- Check the right region and service. AWS status pages break down by region. If your google cloud project also runs, combine checks from both providers in the same gate.
- Use a timeout. If the API call fails, do not block the deploy. Treat a timeout as a warning, not a stop.
- Combine with synthetic tests. A status check alone can give false positives. Pair it with a small ping to your critical endpoints for a fuller picture.
- Log everything. Every time the gate stops a deploy, log why. Later, review those logs to tune your rules.
When you integrate monitoring into your pipeline, you turn passive awareness into active protection. The CloudZero blog notes that best practices for AWS monitoring include automation and alerting across your stack. Pipelines are the perfect place to apply that.
As you build out these automated checks, you may also want to explore how AI can help validate your code faster. Check out our guide on AI coding assistants and building trust in automated workflows to see how modern tools handle that.
Your CI/CD pipeline is your last line of defense. Giving it real time aws status data means you never deploy into a fire. Start small with one gate today. Your users will thank you tomorrow.
Building Resilient AWS Architectures to Minimize Downtime Impact
Even with perfect aws status monitoring, if your architecture has a single point of failure, you are still at risk. The numbers do not lie. In 2026, a single hour of IT downtime costs the average mid-size or large enterprise more than $300,000, according to ITIC research cited by Dotcom-Monitor. For manufacturing facilities, that figure hits $260,000 per hour, and data centers can lose $300,000 to $540,000 per hour, as N1 Critical Technologies reports. The math makes one thing clear: you cannot just watch for trouble. You have to design your system so trouble barely matters.
Spread Your Eggs Across Zones and Regions
The most effective way to survive an outage is to never have all your resources in one basket.
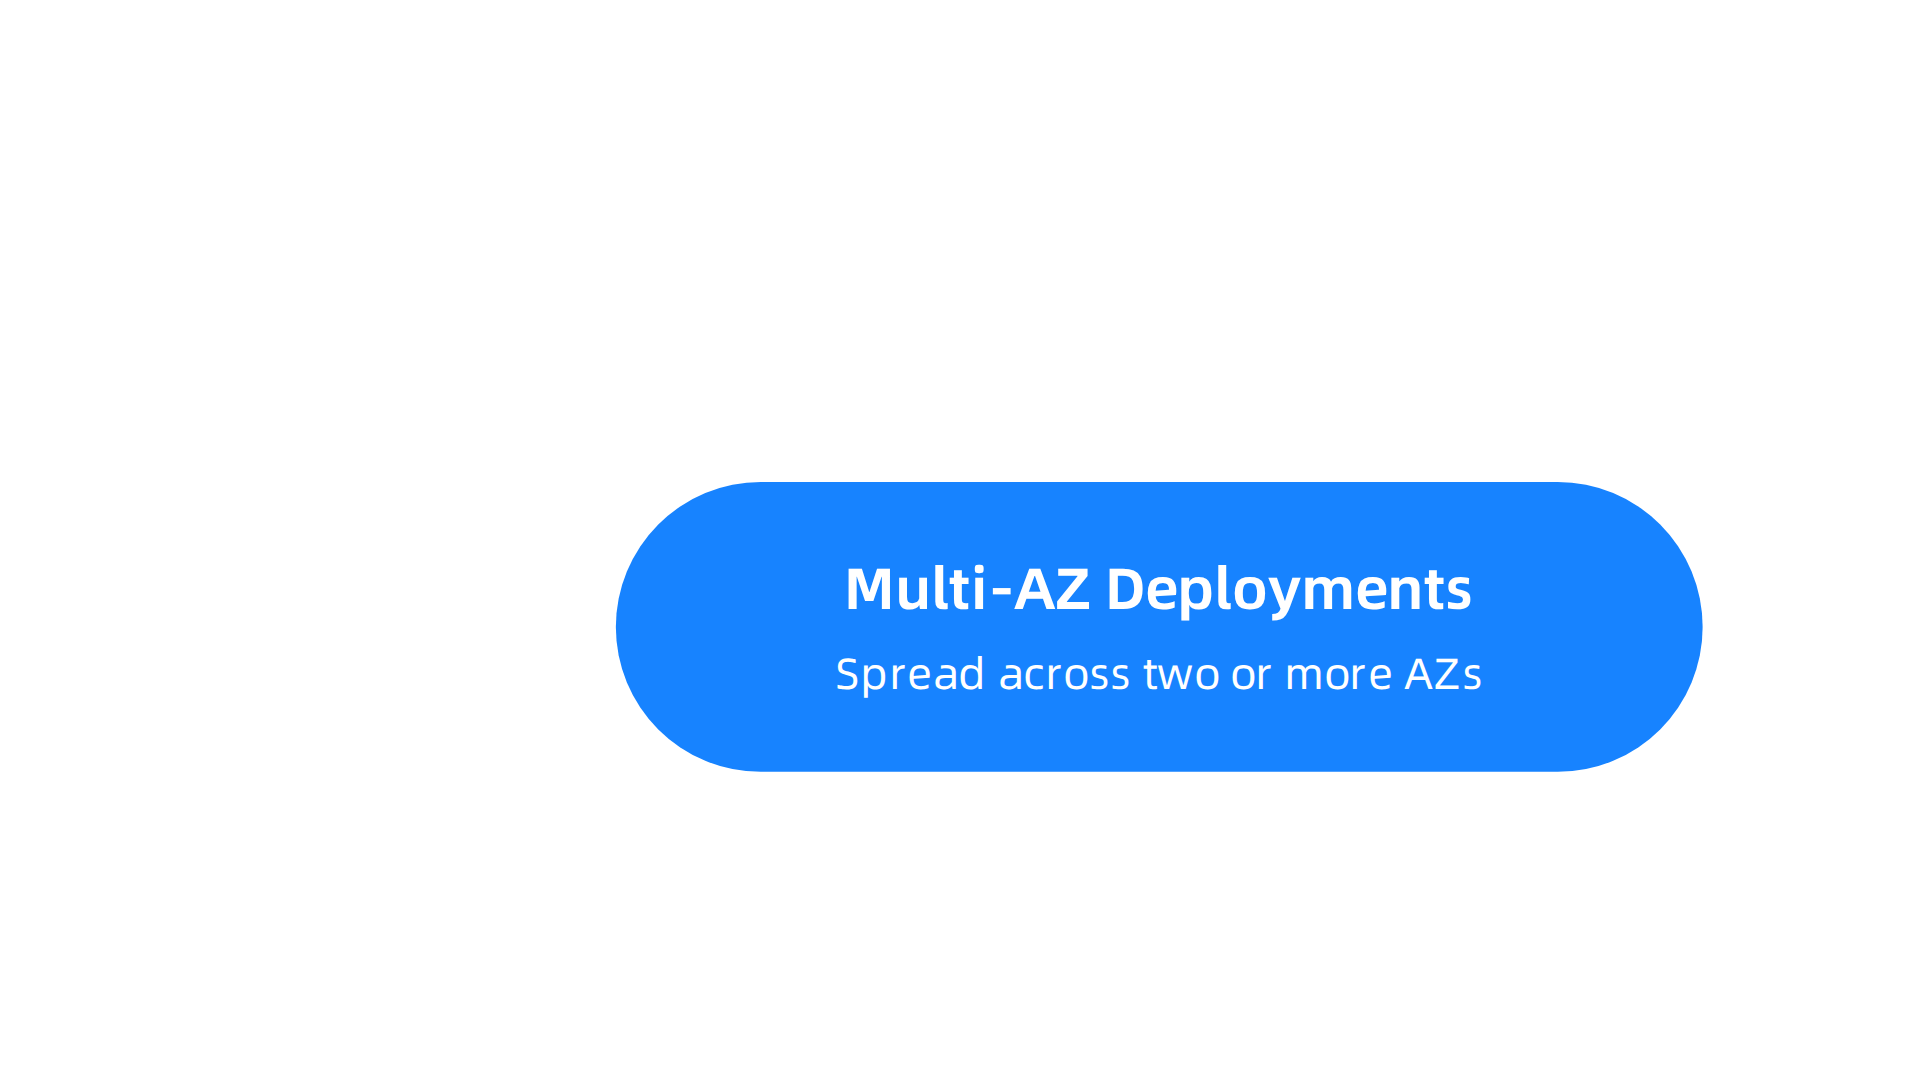
AWS makes this straightforward with multi-Availability Zone (AZ) deployments. When you spread your aws lambda functions and EC2 instances across two or more AZs, a failure in one data center barely registers. Your application keeps running.
For even stronger protection, go multi-region. This is your disaster-level safety net. Cross-region replication of databases and DNS based traffic routing with Route 53 means that if an entire AWS region goes dark, your users get rerouted automatically. The AWS blog on building resilient multi-region serverless applications explains how serverless architectures provide high availability through multi-AZ deployments and built-in scalability. And for a deeper look at the best practices, the re:Invent 2024 session on multi-region strategies covers two critical patterns every team should know.
Let Auto-Scaling and Load Balancing Do the Heavy Lifting
You cannot predict every spike in traffic or every partial service degradation. But you can build systems that react automatically. Auto-scaling groups add more compute capacity when demand rises. Load balancers distribute traffic only to healthy instances. Together, they maintain performance even when some parts of your stack struggle. The Stormit article on AWS high availability architecture shows how ALB, EC2 Auto Scaling, and Route 53 work in concert to stop single points of failure.
Test Your Resilience with Chaos Engineering
Here is the uncomfortable truth: you do not know if your architecture is resilient until you prove it breaks gracefully. That is where chaos engineering comes in. You deliberately inject failures into your system during low traffic hours. You shut down an AZ. You throttle a database. Then you watch how your system responds. This practice turns your aws status monitoring from a passive report into an active stress test.
As you design these resilient architectures, you might also want to explore how modern app development trends shape the tools you choose. Check out our guide on startup app development trends in 2026 to see what actually works for building scalable applications.
Resilience is not a feature you add later. It is a design principle you bake in from the start.

Combine multi-region deployment, auto-scaling, and regular chaos tests, and you turn a potential $300,000 disaster into a minor blip on your dashboard. Your users never notice. And that is the whole point.
The Future of Cloud Monitoring: AI-Powered Predictive Analytics
So you have built a rock-solid multi-region architecture. You run chaos tests. Your team watches the dashboards and jumps when an alert fires. But here is the problem: most monitoring is still reactive. Something breaks, you get paged, you fix it. In 2026, that approach is costing teams too much sleep and too many dollars.
Why Reacting Is Not Enough
Traditional monitoring floods you with alerts. Many of those alerts are false alarms. Your team gets tired, starts ignoring them, and then a real outage slips through. That is alert fatigue. And it is expensive.
But what if your system could warn you before anything actually broke? That is the promise of AI-powered predictive analytics. Instead of waiting for a server to fail, machine learning models watch your aws status metrics, logs, and traffic patterns. They learn what "normal" looks like. When something starts to drift, the model flags it as an anomaly. You get a warning hours or even days early.
How Machine Learning Predicts Outages
The idea is simple but powerful. AI tools analyze continuous data streams. They look at latency, error rates, CPU usage, memory pressure, and more. Over time, the model spots patterns that humans never could. For example, a slight increase in response time combined with a small uptick in database connections might be the first sign of a memory leak. A human might miss it. The AI catches it.
According to Solzorro’s analysis of AI outage prediction, machine learning can forecast system failures before they happen by monitoring IT environments. And FlairsTech reports that ServiceNow customers using AI prevent 25% to 35% of critical P1 outages. That is massive.
The Rise of AIOps
All of this falls under a bigger trend called AIOps (Artificial Intelligence for IT Operations). AIOps platforms take in all your monitoring data, correlate events across different services, and surface only the alerts that matter. No more noise. No more paging the whole team for a blip.
In fact, Artesis real-world data shows AI-powered predictive maintenance reduces infrastructure failures by 73%. That applies to cloud systems too. Your aws lambda functions and EC2 instances get the same treatment.
What This Means for Your Team
The shift from reactive to predictive changes how you operate your cloud. Instead of constantly firefighting, your team can focus on improving architecture and building new features. The monitoring system becomes a silent guardian that only interrupts when it truly matters.
If you want to stay ahead of these AI trends, there is a resource that delivers clear daily updates without the hype. The Deep View Newsletter gives you concise AI news and practical insights. It is worth adding to your morning routine.
And if you are curious about how AI is reshaping the developer workflow itself, check out our guide on AI coding assistants in 2026. It explains how tools like Cluely AI are earning trust through better prompt engineering.
Predictive analytics is not science fiction anymore. It is available now, and it is transforming cloud monitoring from a rearview mirror into a forward-looking radar. Start using it, and you will stop chasing outages and start preventing them.
Now, none of that predictive power matters if your users are left in the dark when something actually goes wrong. The best AI model in the world can’t fix a lack of trust. And trust is built on one thing: clear, honest communication during an outage.
Communicating AWS Status to Stakeholders and Users
Here is the reality. Every cloud service has hiccups. AWS itself has had well documented regional failures. The difference between a small blip and a full blown crisis often comes down to how you talk about it.

If you stay silent while your users refresh a broken page, you lose their confidence. If you post a simple, honest update on a public status page, you keep it.
That is why transparent communication must be part of your incident response plan. You should already know exactly how you will update people before the next alarm fires. Your plan should answer three questions:
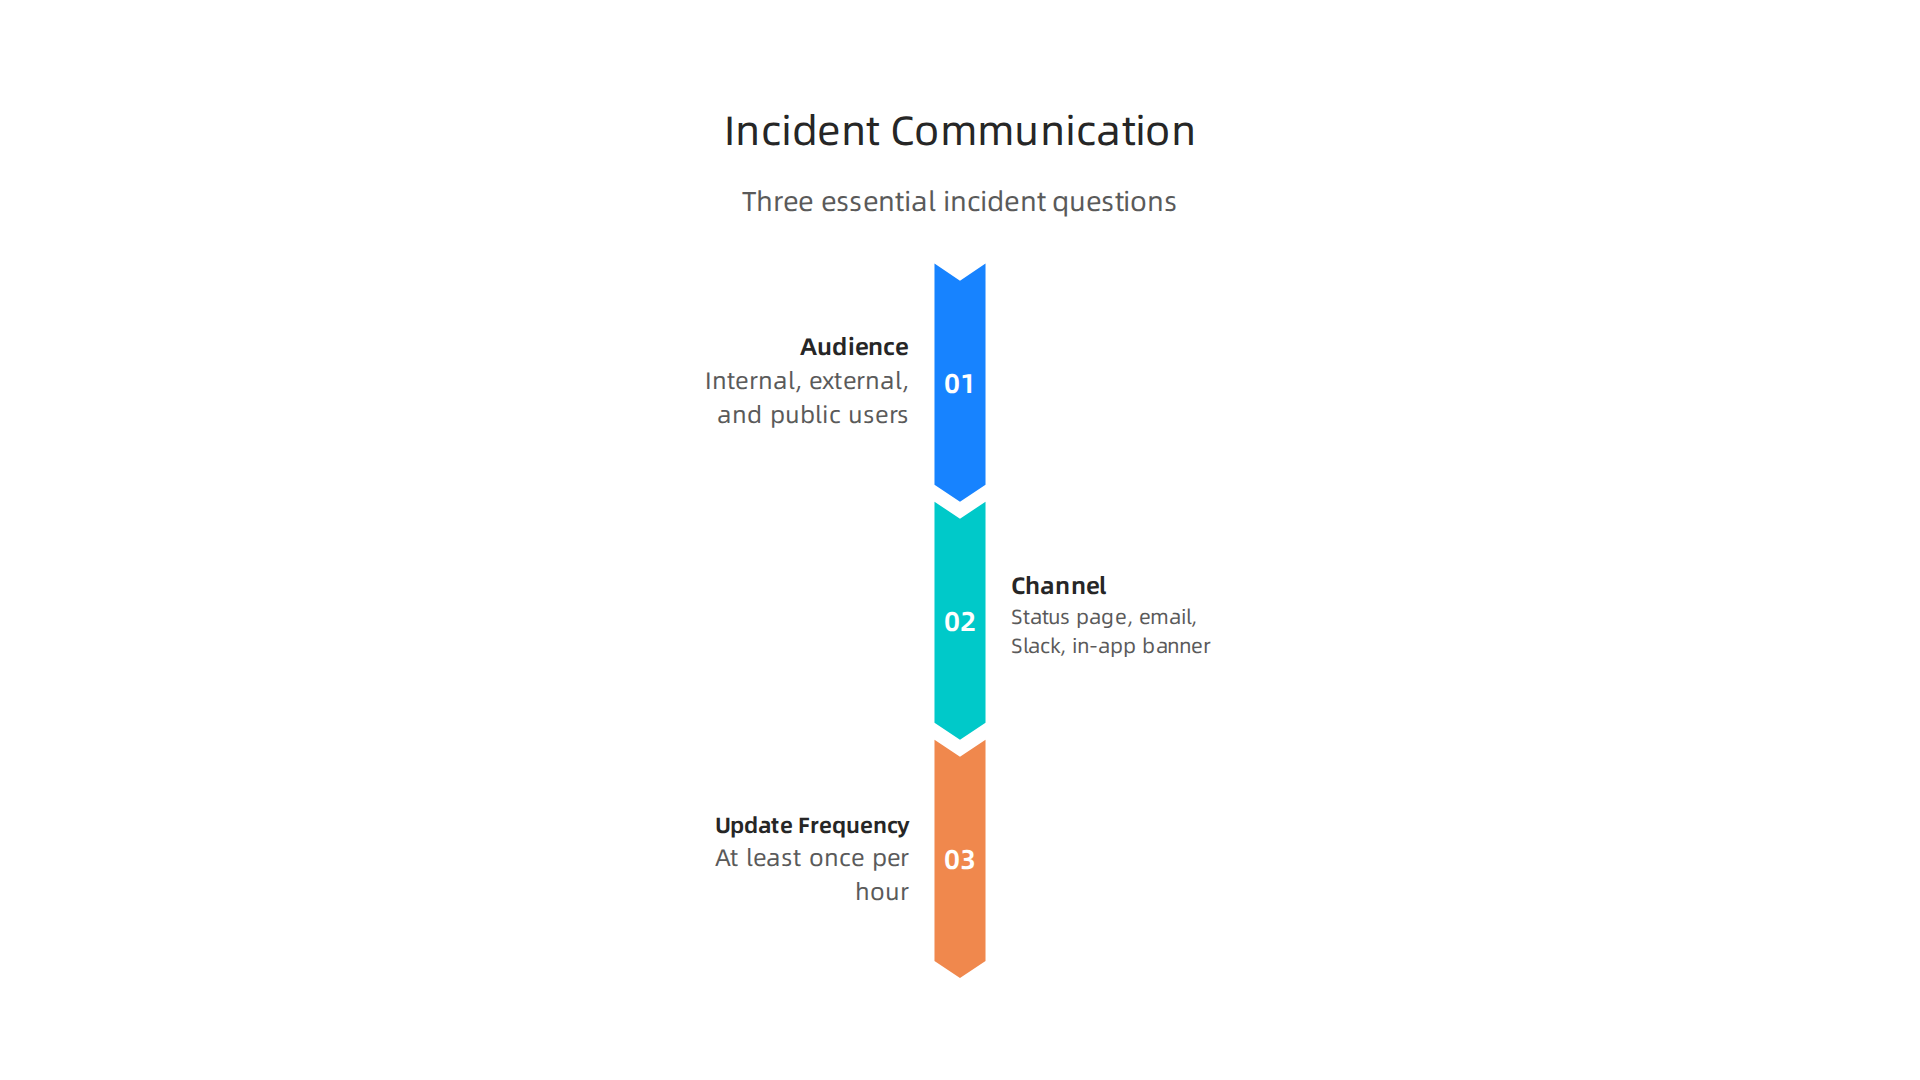
- Who needs to know? Internal teams, external customers, and maybe the wider public.
- What channel will you use? A public status page, automated email, Slack, or an in app banner.
- How often will you update? Even if there is no new information, a "we are still working on it" message every hour reduces anxiety.
Use the Official AWS Status Page as Your Starting Point
The first thing you should do during any suspected outage is check the AWS Health Dashboard. This official page shows the current status of every service across all regions. If you are running a service on AWS Lambda and you see a yellow warning icon next to Lambda in us-east-1, you can immediately tell your users, "We are aware of a regional issue with our cloud provider. We are monitoring it closely."
Do not make your users dig for that information. Publish a link to your own status page and include a summary. Tools like StatusGator can even watch the AWS status page for you and push automated alerts to your team and your users.
Build a Simple Public Status Page
You do not need a fancy system. A small HTML page hosted on a different cloud provider (like a Google Cloud Project) can be enough. The key is that it stays up even if your main AWS infrastructure goes down. List the services you run, their current status, and a short message. For example, if your app is an online java compiler that runs on AWS Lambda, your status page might say: "Compiler service is degraded. We are working with AWS to restore full functionality."
Being honest about the problem builds trust. According to Atlassian’s comprehensive guide on AWS status monitoring, transparent status pages are a best practice that many top SaaS companies follow.
Automate Where You Can
Manual updates are slow and error prone. Use tools that integrate with your incident management system to post updates automatically. Some teams even use AI to draft status messages based on monitoring data. For a closer look at how AI tools are transforming developer workflows, check out our guide on AI coding assistants in 2026. That same logic applies to automating communications.
In short: plan your updates before the crisis. Use the official AWS dashboard. Keep a backup status page on a separate cloud. And always, always tell your users what you know, even if you don’t know much yet. It is the fastest way to turn a bad incident into a story of reliability.
Summary
This guide explains how to monitor AWS status, react to outages, and build systems that keep running when cloud services fail. It walks through the official AWS Health Dashboard, how AWS communicates incidents, and why you should automate alerts rather than checking the status page only after something breaks. The article compares third‑party and open‑source monitoring tools (Datadog, New Relic, Dynatrace, SigNoz, nOps) and shows how to pick the right fit for multi‑cloud setups. It gives concrete steps for wiring status checks into CI/CD pipelines, setting deploy gates, and logging decisions to avoid broken releases. You’ll also learn architecture patterns—multi‑AZ, multi‑region, auto‑scaling, load balancers—and the role of chaos engineering to validate resilience. Finally, the guide covers AI‑driven predictive analytics (AIOps) to reduce false alerts and detect problems earlier, plus best practices for honest incident communication to preserve trust during outages.